|
To June 30th 2025: |
LRCP Equity Fund I Gross |
LRCP Equity Fund I Net |
S&P 500 |
Russell 2000 |
MSCI (MSCI) World |
|
Trailing 6-month Total Return: |
-1.7% |
-1.7% |
6.2% |
-1.8% |
6.9% |
|
Trailing 1.5-yr Total Return: |
49.8% |
37.9% |
32.8% |
9.5% |
29.9% |
|
Trailing 2.5-yr Total Return: |
104.5% |
77.1% |
67.6% |
28.0% |
60.9% |
|
Trailing 3.5-yr Total Return: |
130.1% |
95.3% |
37.2% |
1.8% |
32.4% |
|
Trailing 4.5-yr Total Return: |
226.2% |
158.6% |
76.6% |
16.9% |
62.1% |
|
Trailing 5.5-yr Total Return: |
260.8% |
181.9% |
109.1% |
40.2% |
88.8% |
|
Trailing 6.5-yr Total Return: |
269.8% |
188.9% |
174.9% |
76.0% |
141.9% |
|
Trailing 7.5-yr Total Return: |
255.8% |
177.9% |
162.9% |
54.5% |
125.2% |
| The figures above are on a cumulative basis and are unaudited. Future results will also be presented on a cumulative basis in this section. Annual results will be illustrated below for those who wish to measure us based on 12-month cycles. However, we view the cumulative results as most meaningful since we are trying to build wealth far into the future and the annual results are only important in as much as they contribute to a 3, 5, 10, and 20-year track record. |
|
Annual/Interim Results: |
LRCP Equity Fund I Gross |
LRCP Equity Fund I Net |
S&P 500 Energy |
AMZ |
XAL |
|
1H25: |
-1.7% |
-1.7% |
.08% |
7.1% |
-15.9% |
|
2024: |
52.4% |
40.3% |
5.7% |
24.4% |
-1.0% |
|
2023: |
36.5% |
28.4% |
-.6% |
26.6% |
28.2% |
|
2022: |
12.5% |
10.3% |
64.2% |
30.5% |
-35.0% |
|
2021: |
41.8% |
32.4% |
53.3% |
39.9% |
-1.7% |
|
2020: |
10.6% |
9.0% |
-33.7% |
-28.8% |
-24.2% |
|
2019: |
2.5% |
2.5% |
11.8% |
6.5% |
21.3% |
|
2018: |
-3.8% |
-3.8% |
-18.1% |
-12.4% |
-22.4% |
| To reiterate, our goal is to have good absolute returns first and foremost, which should lead to good relative returns versus the broader markets. However, I also think it’s important to highlight the performance of the primary sectors in which we feel we have an advantage and in which we invest. There is no reason to present this other than for transparency reasons. Owning a highly concentrated portfolio will prevent our results from looking like anything we compare them to in most years, but knowing the performance of energy broadly, midstream energy specifically, and North American airlines will add some context for those partners who wish to do some higher-level analysis. Please see the accompanying disclaimer & footnotes at the end of the letter for a broader description of each of these indices. |
RESULTS FOR 1H2025
The partnership returned -1.7% gross and net of performance fees through June. By not clearing our 4% hurdle rate one can definitively say we’ve earned our fee so far this year—0%. With families to feed, upcoming college tuition for kids, and Global Services-levels of spending at the Kelley’s neighborhood orthodontist, we aim to do much better so we in fact do earn a performance fee. The curveballs thrown by governments this year caught everyone a bit on their heels and made staying in the batter’s box unnerving. But stay we have. In fact, we’ve dug in a little and found some decent—albeit small for us— opportunities, one of which we highlight below.
Luckily, we took some of our airline chips off the table early in the year before cracks started to form in the demand environment, but that sector specifically was still a drag on performance the first half of the year. However, supply continues to exit the system so we think fundamentals will be quite strong once the myriad issues weighing on consumers and the economy start to improve. In the meantime, we’ve taken the opportunity to restructure our airline position and improve the risk/reward over the next couple of years. Frankly, we’d get greedy if the stocks went lower from here.
By far our biggest exposure continues to be to energy, specifically oil & gas pipelines, but we haven’t bought or sold much of anything in this subsector for close to 2-years now. While the price environment for crude oil continues to deteriorate, we think pipeline fundamentals will prove resilient due to strong natural gas and natural gas liquids volumes and we’ll look to add more if the stocks sell off with commodities. The holding period for our two biggest positions, both pipeline companies, is well over 5- years and any opportunity to add to them at 8%+ yields will be capitalized on despite already being close to 30% of fund assets. They are phenomenal businesses and it’s plausible we own both for the life of this Partnership.
With the addition of our two new small(er) positions we’re at 11 owned names, but don’t accuse us of diversifying: the 3 biggest, plus cash, are 63% of fund assets. And with the partnership’s dividend yield at 6.7% and cash at 22%, we’re really well positioned to grind out decent returns and/or get more aggressive depending on what opportunities the market offers. An ideal situation in our humble opinion.
However, if the YOLO-FOMO investing strategy(?), philosophy(?), dogma(?), whatever you call it, persists I’m sure we’ll struggle to keep up with the indices, just as we did in 2019 & 2020. Widely diverging valuations between the moonshots and the types of companies we own helped establish our current track record, so we’re quite comfortable with the setup.
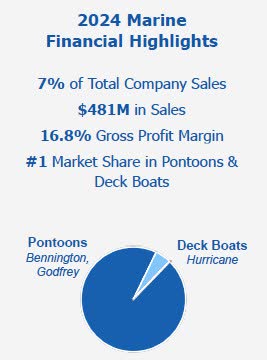
POLARIS INC (PII)
One of the new investments we made this year is in Polaris (PII), a manufacturer of powersports vehicles, including: Side-by-sides, ATVs, snowmobiles (Off-Road Segment), motorcycles (On-Road Segment), and boats (Marine Segment). Side-by-sides—Rangers and Razors—look like mini-trucks and dune buggy type vehicles, respectively.
For guys who invest in energy primarily and airlines secondarily, it may seem odd we’ve now invested in a consumer discretionary stock. The truth is we’re closet generalist investors at heart and just love the expansive treasure hunt and ensuing poker game, which opportunities like this help satiate. But we’re industry-focused practitioners, so any investment touching the outside edge of our circle of competence—which Polaris is—will be small, i.e., much less than a 10% position at our purchase price.
To be clear I’ve done this in the fund before. Back in 2018, I invested in L Brands (Victoria’s Secret (VSCO)). We previously owned it in the mutual fund I worked on at Janus and between my departure and the founding of this Partnership the stock proceeded to drop like a rock. I just couldn’t help myself, so I bought a little. However, I quickly learned I really knew next to nothing about retail businesses and sold the stock at a small loss. That was this Partnership’s last foray away from energy and airlines until now.
But rest assured, Polaris is not Victoria’s Secret. First off, Polaris is a manufacturer that sells through a large network of independently owned dealerships; it’s not a retailer. Second, as guys who have been married a long-time, and who love to hunt big game in Colorado, we interact with Polaris products significantly more than VS products these days, sadly enough, so we have a much better handle on the brand. Lastly, I still own a small Polaris dealership in rural Wyoming, and through that experience I can attest to the fact that the core money making Polaris products in the Off-Road segment are essential to farmers, ranchers, and fellow outdoorsmen. Polaris is the brand and technology leader in the segment, and we think the ORV business alone is worth more than the entirety of all their businesses as currently valued by the market.
However, despite the cyclical factors that are currently weighing on company fundamentals, in our opinion management’s uninspiring capital allocation decisions over the past decade prevent full realization of intrinsic value, no matter the economic backdrop. Initially I thought we were getting the opportunity to buy a really good company at a bargain just due to normal cyclicality but magnified by tariff noise, and I thought shares were worth around $100 exiting the cyclical trough, but my perspective changed as I learned more. Subsequently, I think if a more thoughtful approach to capital allocation is implemented the stock could be worth up to $200 over the next few years. Therefore, the risk/reward appears favorable under either scenario based on the Partnership’s $41 average purchase price. Shares currently trade at $47 but were below $31 in April; a 15-year low despite 17% fewer shares outstanding!
Our goal here is to simply shed some light on what’s gone wrong by stepping back and making big picture observations in the hope management considers an alternative path, or to inspire a better funded and more actively inclined investor to get involved and help press the case.
Observation 1: The Crown Jewel of the Business Hasn’t Changed
In 2014, Polaris was an $11 Billion enterprise, 99% of which was equity value. Today it’s a $4.4 Billion enterprise, only 59% of which is equity value. Yet the company work horse where it pertains to generating revenue, gross profit, cash flow and returns hasn’t changed much.
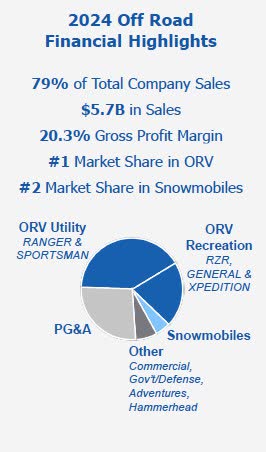
The Off-Road Vehicle (ORV) segment (Rangers, Razors, Snowmobiles) made $1.2 Billion in Gross Profit in 2014 (91% of overall GP) and made $1.16 Billion in 2024 (79% of overall GP). Apart from the 2-year spike
in sales for all things outdoor related coming out of COVID, the business has been relatively steady and profitable.
ORV/Snowmobile Gross Profit Contribution ($000’s)
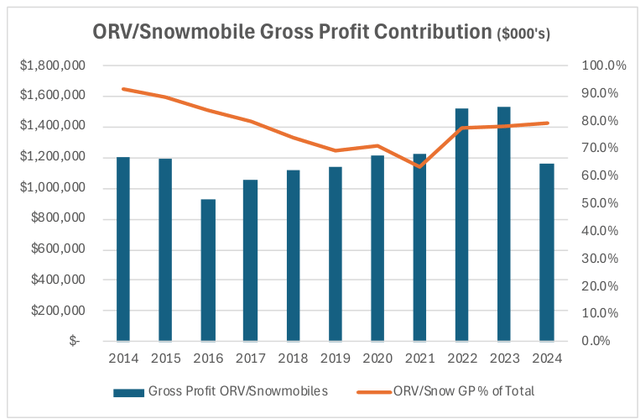
By all accounts, including estimates made by their 2nd largest competitor (BRP), Polaris has the #1 market share in ORV, and is close to an overall market share equal to the #2 & #3 competitors combined. The brand is strong and through a continued focus on product quality and innovation they should be able to maintain that lead, if not grow it.
Not only is this segment keeping the business afloat during the current powersports recession, but it’s also responsible for meeting broader corporate goals on the other side of it. When asked in March what it will take to hit management’s mid-cycle margin targets, the CFO said: “Off Road is down less, but it’s also far and away our most profitable segment. So any recovery in Off Road dwarfs any benefit we can get from motorcycles or snow…So, the driver of those mid-cycle margins is going to be primarily recovery in ORV.”
What happened to this business that was once valued at $11 Billion, sold for $159 a share, generated 67%+ returns on capital and traded at 23x earnings? Growth. Or the pursuit of it at least.
Observation 2: “Growth” Led to Poor Returns on Incremental Capital Deployed
The current CEO and CFO took over in 2021. However, prior to assuming these titles the CEO was CFO starting in 2015 and the CFO was SVP of Corporate Development starting in 2016, so both had meaningful roles to play in the company’s transformation over the past decade, specifically when it comes to allocating capital. And the allocation of capital hasn’t been stellar.
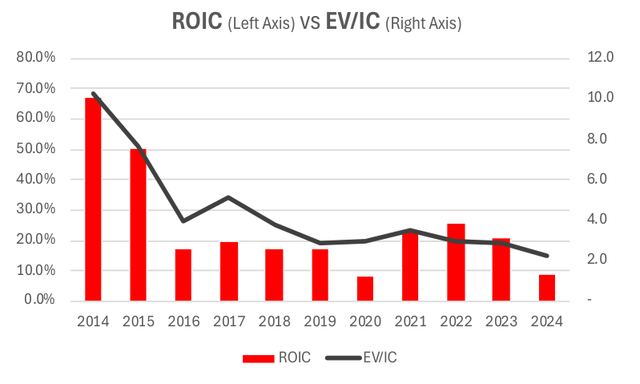
The next two charts highlight the primary issue: large amounts of incremental capital have been deployed at negative returns which destroyed shareholder value.
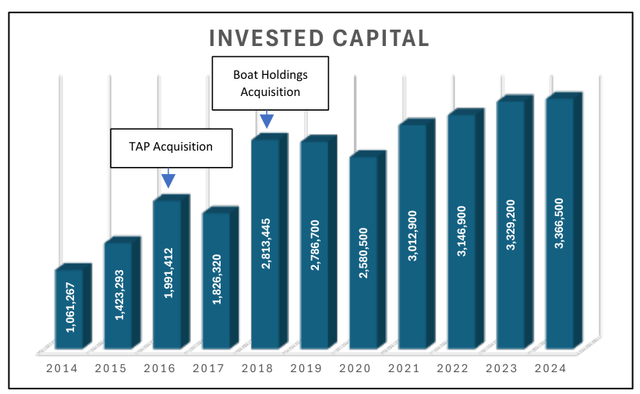
While not reflected in the above graph, Polaris’ capital base really started growing rapidly coming out of the Great Financial Crises of 2008-2009, but returns on that capital were spectacular; Return On Invested Capital (ROIC) increased from 40% to 71% from 2009 to 2013, despite Invested Capital doubling. The increases in capital most directly tied to sharply declining ROIC slowly begins around 2014. But the step change in severe capital impairment occurred in 2016 and 2018 with the acquisitions of Transamerican Auto Parts (TAP) for $740mn and Boat Holdings for $805mn, respectively. From 2014 to 2018 Invested Capital tripled, yet Operating Income declined from $714mn in 2014 to $487mn in 2018. Mathematically, it’s inarguable that a ton of value was destroyed. With Operating Income barely surpassing 2014’s results only in 2022, management can’t even argue they made long-term investments that merely took time to earn the company’s cost of capital, let alone exceed it.
And, as shown on the right, the market noticed. A business that earns 50%+ returns on capital should obviously trade at a high multiple of the invested capital base, which Polaris did. But every incremental dollar retained or raised by the business must earn equally high returns on that capital to sustain the multiple. It’s the incremental returns on capital that really matter. PII management invested relatively large amounts of capital at inferior returns and shareholders paid the price.
Observation 3: “Growth” Made the Company Worse
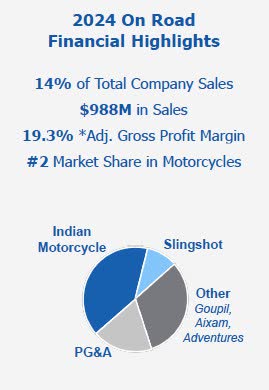
Per the company’s most recent Capital Market’s Day presentation, industry wide volume for ORVs is expected to be flat(ish) in 2025, when compared to pre-COVID averages. Yet following five straight years of industry declines, On-Road is expected to be down 26% and Marine down 21%. In pursuit of growth, close to $2 Billion has been “invested” into other non-core businesses, but they have only been able to generate an incremental $270mn of annual Gross Profit1. Not great!
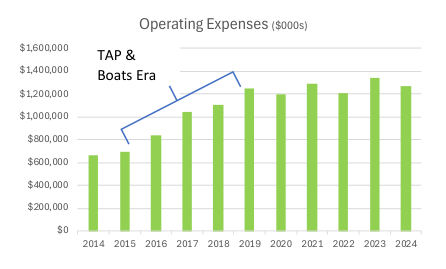
Thus, a high returning, highly profitable, focused business was errantly transformed into a more cyclical and bloated business through acquisitions over the past decade. Operating expenses have exploded from $666mn to $1.27 Billion; the number of employees went from 7,000 to 15,000; total warehouse and distribution square footage increased.
Undoubtedly, the added complexity not only diverted precious capital but has also diverted management’s attention. There are 11 slices in the pie charts laid out in company slides describing what the company does, but only 3 really matter.
Notice there is no mention of TAP in the pie charts above. That’s because it was eventually sold for $42mn in 2022; a $626mn tax adjusted capital loss in 6-years. Additionally, a mere 1,700 employees left with the sale and the capital invested to make that acquisition still sits on the balance sheet—net debt increased $710mn the year they purchased TAP and it has not come close to pre-acquisition levels since.
Taking risks is obviously necessary in business, we get that, but risks shouldn’t consume such large relative amounts of capital and mindshare of the company. And then when the risks don’t work out, it is imperative management resize the capital base to reflect the dearth of associated return.
And repeating prior mistakes is unforgivable: The 2004 10-K says Polaris exited Marine because “The marine products division continued to experience escalating costs and increasing competitive pressures and was never profitable.” Yet 14-years later they invested the equivalent of 45% of the prior year’s capital base to reenter it. Did the boat business change that much in 14-years? Apparently it hasn’t, because the average annual segment Gross Profit since the Boat acquisition is $147mn, yet SG&A increased $150mn from 2017-2019 (the full year after Boat Holdings vs. the full year before Boat Holdings). Perhaps some of that incremental SG&A is attributable to other segments? I’m not sure, but either way the math doesn’t seem to justify anywhere near an $805mn investment. Related to that acquisition management recently said: “we’re still making high single-digit EBITDA in this business. Strong cash flow. We’ve repaid a good portion of the original investment we made back in 2018. So really proud of that portfolio” & “the complete amount that we paid for the business, we paid a lot of it back now”. It’s
been 7-years since that investment was made, and a 7-year payback suggests a 14% return, but the corporate ROIC the year before the acquisition was 20%. That’s not good. It also suggests $115mn a year of associated free cash flow at the $805mn purchase price, but that doesn’t square at all with the Gross Profit minus SG&A math mentioned above. Something’s amiss. But it doesn’t matter! That would only apply if they had been paid back all of the original purchase price after 7-years, not “a good portion of”, or “a lot of” it.
Observation 4: Buy High, Hold Low, is Confounding
“If you look at the history of share repurchases, they fall off like crazy when stocks are cheap and tend to go up dramatically when stocks get fully priced…It’s not a complicated question, but I’ve been around a lot of managements that announce they’re going to buy X worth and then they buy it regardless of price. A lot of times the price makes sense—but if it doesn’t, they don’t seem to stop, and nobody seems to want to stop them.” Warren Buffett, 2015 Berkshire Hathaway (BRK.B) Annual Meeting
Polaris has a long history of returning capital to shareholders, it’s one of the reasons we’ve kept the stock on our radar for a while, and we appreciate the overall philosophy. However, the implementation needs some major refinement.
Since 2014 management has spent $2.4 Billion on share repurchases yet has only retired 17% of diluted shares outstanding. The current market capitalization of the company is a mere $2.6 Billion! The issue is twofold: high levels of share-based compensation and procyclical repurchases. I won’t comment on the amount of dilution created through employee stock programs since we like employees having skin in the game. But I also think what, at times, amounts to 2% annual dilution is a little rich. Regardless, if management were better at buying in shares at the lows and not doing anything at the highs, this would probably be a moot point. But in a year like the current one, when share repurchases are limited to simply offsetting dilution from stock-based compensation, it rubs the wrong way.
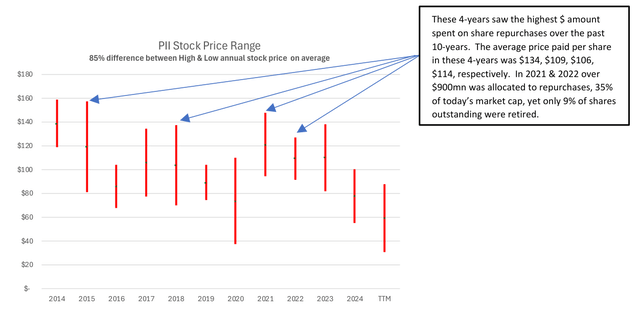
Repurchases made in 2021 & 2022 were done in an environment when PII stock volatility was low and the average price was high. The years when management spent the least were 2019, 2020, 2024, and this
year, all coinciding with low share prices. I understand why the temptation to repurchase shares tends to be procyclical (the business environment is good, outlook rosy, cash balances are growing), but I’ll never understand why CEOs and CFOs don’t act more contrarian and fight that temptation. Not only does this fail to maximize shareholder value, but it also destroys value when executed above the firm’s intrinsic value. Management knows this asset better than any other—having legal inside information—so passing on $30 a share when you just levered the balance sheet to purchase at $100 a share is pure madness. You can’t tell me that if management found another Boat Holdings selling for $270mn versus the $805mn they paid, they wouldn’t find a way to make that acquisition happen.
In 2022 management repurchased 4% of their shares outstanding and share repurchases were highlighted as a top 3 priority for capital deployment that year. Today they could retire 20% of their shares if they spent the same amount yet share repurchases doesn’t even make an appearance on the latest Capital Deployment Strategy slide. Higher priorities include: Investing in the business—of course we agree; Maintaining dividend aristocrat status—we couldn’t disagree more; Paying down debt—no way around it because of their prior decisions. The market is giving them an opportunity to correct a lot of their prior investment mistakes, and they want no part of it.
It goes without saying, if Nate and I only deployed capital when share prices were high and the outlook seemed certain, our LPs would fire us in a heartbeat, and we’d be out of a job. Polaris management has to do a significantly better job repurchasing shares going forward.
What would we do?
First off, we’re cognizant of the fact that we’re the corporate strategy equivalent of fantasy football players. We can rattle off the statistics, but we don’t know what it’s like “between the lines”. That’s why we stuck with pretty high-level observations, and our “recommendations” follow the same script. Generally, we’d stop doing the things that got the company here and do what it takes to get back to looking as much like 2014 as possible. A bit more specifically, we would encourage the following:
- No more acquisitions.
- Reduce the capital base through non-core asset sales. The only sacred cow should be the ORV segment, ex-snowmobiles. Everything else should be on the table, and there’s a lot there.
- Pay down debt. Through asset sales and cash flow shoot for $400mn over the next 2-years.
- Know the intrinsic value of your business and buy shares when it’s cheap. Repurchase shares now, as much as possible, and from now on have really low leverage going into the peak of the cycle and higher leverage coming out of the trough…with the additional debt allocated to repurchases then the debt repaid on the other side of the economic cycle. $500mn retires 20% of the shares. Shoot for that over the next 2-years with cash from operations and asset sales. But only if the shares are trading below intrinsic value.
- Stop paying a dividend. Redirect it to debt and share repurchases. That’s $300mn over 2-years. If this was a private business it would be reckless to maintain your payout in this environment, but to increase it, all to say you’ve increased it for 30-years, is nuts. If it doesn’t make sense for a private company it generally doesn’t make sense for a public company either.
- Find a way to dramatically right size SG&A. How much SG&A is required to support the ORV business? Up until 2016 Operating Expenses were below $700mn. Why isn’t that an achievable number?
Executing on a 3-5 year plan to refocus the business and balance sheet while deftly buying a meaningful number of shares below intrinsic value could easily drive ROIC back above 30%, free cash flow per share
and earnings per share over $10, and help restore a premium valuation. Growth in those metrics is what we care about.
I’m sure our thoughts seem draconian and could easily be couched as an over-reaction to short-term economic headwinds, but hopefully we’ve shown that in fact it’s been a slow moving trainwreck over the past 10-years. Fortunately, because the locomotive is still on the tracks it shouldn’t take half as long to pick up the pieces and get moving again. We’re optimistic!
Best Regards,
Kristopher P. Kelley
|
Disclaimer & Footnotes This letter is for informational purposes only and does not reflect all of the positions bought, sold, or held by Legacy Ridge Capital Partners Equity Fund I, LP. Any performance data is historical in nature and is not an indication of future results. All investments involve risk, including the loss of principal. Legacy Ridge Capital Management LLC disclaims any duty to provide updates to the information contained within this letter. This letter may include forward-looking statements. These forward-looking statements involve known and unknown risks, uncertainties, assumptions and other factors which may cause actual results and performance to be materially different from any future results and/or performance expressed or implied by such forward looking statements. Performance for 2018 is provided by Richey May & Associates, our auditor, and was provided via a Performance Review for a separate account that was transferred into the Fund and constituted 100% of the assets of the Fund as of November 1, 2018. Results are net of fund expenses. All performance related figures for the Partnership are unaudited. Indices are provided as market indicators only. It should not be assumed that any investment vehicles managed by Legacy Ridge Capital Management will, or intend to, match provided indices in holdings, volatility or style. Index returns supplied are believed to be accurate and reliable. The S&P 500 is a market capitalization weighted index that measures the performance of the 500 largest US based companies. The Russell 2000 Index is a market capitalization weighted index that measures the performance of the smallest 2000 stocks in the Russell 3000 Index and is a common benchmark for smaller companies. The MSCI World Index is a market capitalization weighted index that is designed to be a broad measure of equity-market performance throughout the world. It is comprised of stocks from 23 developed countries and 24 emerging markets. The AMZ is an index provided by VettaFi and measures the return of 19 Master Limited Partnerships on a total return basis. The S&P 500 Energy sub-index comprises those companies included in the S&P 500 that are classified as members of the GICS energy sector. There are currently 25 constituents in the S&P 500 Energy sub-index. The XAL is the NYSE Arca Airline Index. There are currently 16 constituents in the XAL, with most domiciled in the US. This letter does not constitute an offer or solicitation to buy an interest in Legacy Ridge Capital Partners Equity Fund I, LP. Such an offer may only be made pursuant to the delivery of an approved confidential private offering memorandum to an investor. This reporting does not include certain information that should be considered relevant to an investment in Legacy Ridge Capital Managements investment vehicles, including, but not limited to significant risk factors and complex tax considerations. For more information please refer to the appropriate Memorandum and read it carefully before you invest. |
Original Post
Editor’s Note: The summary bullets for this article were chosen by Seeking Alpha editors.
Read the full article here